





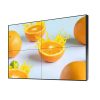

46 Inch 2×2 LCD Video Wall for Retail Analytics Rooms
Description
Use Four Quadrants for Four Retail Questions
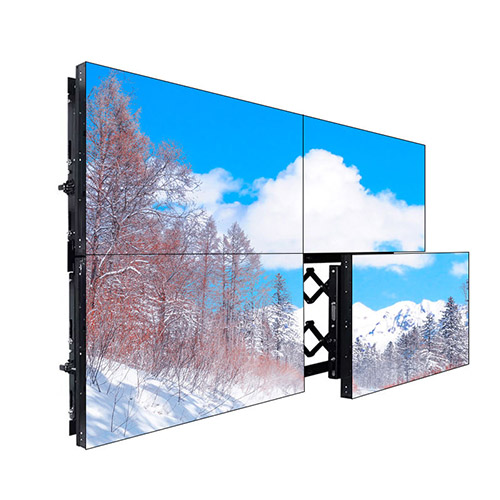
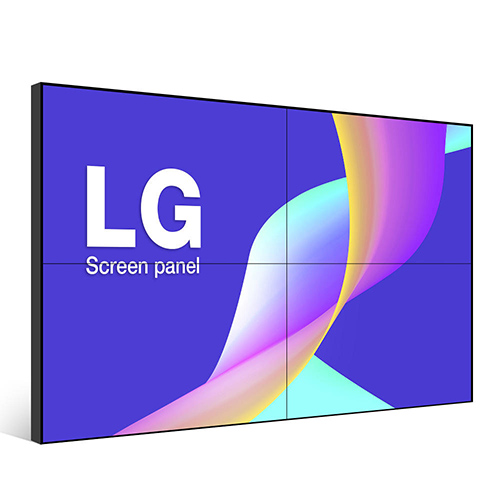
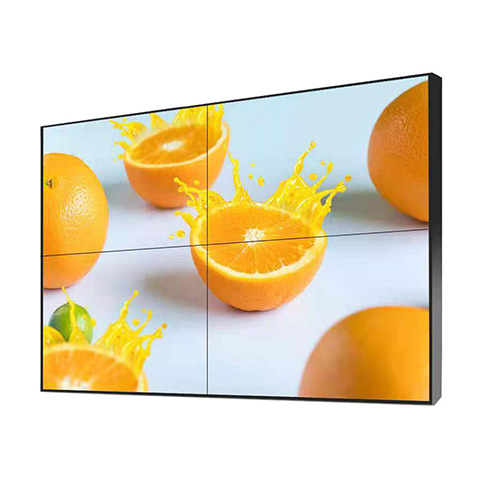
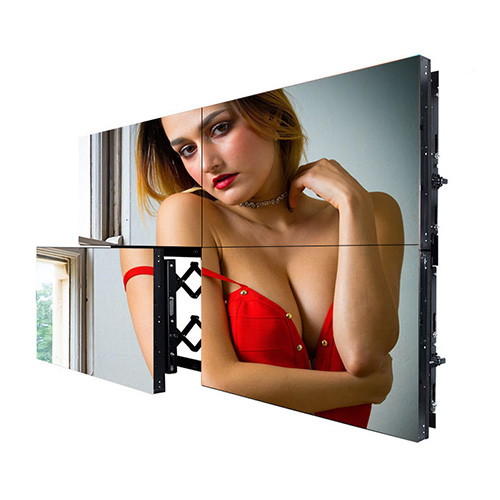
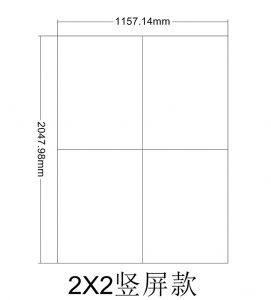
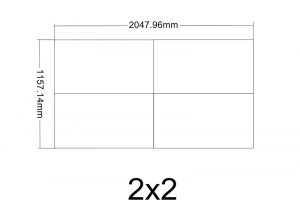
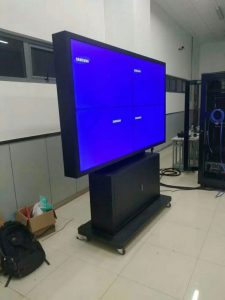
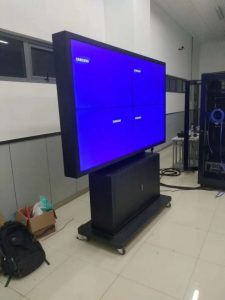
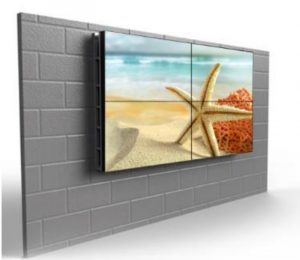
Retail reviews work better when sales, traffic, inventory and store evidence can be compared at the same time. A 46 inch 2×2 LCD video wall for retail analytics rooms uses four 46-inch panels arranged in 2 rows and 2 columns for regional managers, store operations, merchandising, marketing and loss-prevention teams in a compact collaboration room.
The source mix includes sales dashboards, footfall analysis, inventory status, campaign results, store cameras and video conferences. Each dashboard should be tested at the resolution and refresh interval used during the actual weekly review.
Turn Store Data into a Shared Discussion
The four-quadrant arrangement follows assign the four quadrants to sales, footfall, inventory and live store views, switching to a cross-screen chart or remote store meeting for reviews. Managers can preserve one business question per screen and expand a shared chart when the discussion moves to a regional trend.
On a 46 inch 2×2 LCD video wall for retail analytics rooms, the central cross is the worst location for a key number or legend. Dashboard templates need safe zones so a bezel does not split the evidence behind a decision.
Design Dashboards Around the Center Bezel
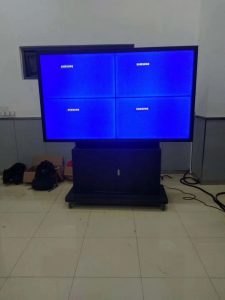
Room size and seating control the installation. 2×2The central cross-shaped bezel can interrupt numbers and legends, so template safe zones should be adjusted and text size on the 46-inch panels confirmed from the farthest meeting-table seat. A dashboard that is readable from the keyboard may still be too small for the farthest participant.
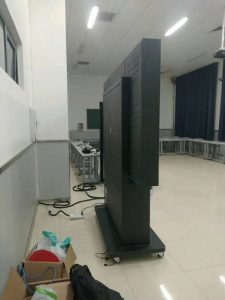
Wall depth, cable access and panel adjustment should be confirmed before meeting-room finishes are completed. Four panels require accurate depth as well as horizontal and vertical alignment.
Fit the Wall into a Compact Analysis Room
The 46 inch 2×2 LCD video wall for retail analytics rooms can receive four independent dashboards, one full-canvas report or a mixture of video and data. Processor capacity should match these review modes rather than an arbitrary maximum.
Give facilitators a small set of named layouts for weekly performance, campaign review, loss prevention and remote store meetings. Fewer clear choices usually improve adoption.
Standardize Data Definitions Before Comparing Stores
A large display cannot fix inconsistent reporting. Sales, traffic and conversion metrics should use the same time period and definition across regions before they are placed side by side.
The review facilitator should be able to open the source or explanation behind a number. Clear data ownership prevents the wall from becoming a decorative collection of conflicting dashboards.
Use Camera Evidence Responsibly
Loss-prevention or merchandising video may support a discussion, but access should follow company policy. Define who may call a camera, whether playback is allowed and what information must remain hidden during broader meetings.
Saved layouts can separate general performance review from restricted investigation. This protects privacy without removing the operational value of visual evidence.
Design a Remote-Store Collaboration Mode
Regional teams may need a store manager on video while reviewing that location’s sales, traffic and inventory. Reserve a participant area and keep the relevant metrics visible beside it.
Test screen sharing from typical store laptops and weaker network connections. The room should degrade gracefully rather than replacing the entire wall with a low-resolution conference feed.
Archive and Retire Campaign Layouts
Campaign presets are useful during launch and review, but old layouts create confusion. Assign an owner and end date so expired promotions are removed from the operator menu.
Keep a small library of reusable structures without retaining obsolete data sources. This makes weekly operation faster and reduces accidental display of outdated information.
Run a Weekly Performance Review Before Acceptance
Acceptance should reproduce a real retail review. use real sales tables, heat maps, store video and remote meetings to test four independent views, full-wall mode, color consistency and data refresh. Participants should be able to read labels, compare stores and move to camera evidence without leaving the shared discussion.
Approve the 46 inch 2×2 LCD video wall for retail analytics rooms only after color, mapping, refresh behavior, preset switching and text scale have been checked from every chair.
Prepare Dashboards Before Final Configuration
Send sample dashboards before the display specification is finalized. Include room dimensions, seating, source resolutions, typical four-quadrant and full-wall layouts, refresh rates, remote-meeting connections and the smallest text used in reports.
This evidence allows the 46 inch 2×2 LCD video wall for retail analytics rooms to be evaluated for readability before purchase. The final package may include panels, mounts, processing, preset setup, cabling, calibration and a short facilitator guide. Sample reports should cover both bright charts and dark camera footage so calibration reflects normal review content.
Frequently Asked Questions
How many panels form the display?
Four 46 inch panels are arranged in two rows and two columns.
What should be kept away from the center cross?
Place critical figures, chart legends, faces and control buttons inside safe areas on individual panels.
Can one chart use all four screens?
Yes, when the controller supports full-wall mapping and the chart is designed for the combined canvas.
How should text size be selected?
Test real dashboards from the farthest seat instead of judging font size only from the operator computer.
You must be logged in to post a review.
Related products
-

3×9 LCD Video Wall for Executive Briefing Centers
Create a Shared Evidence Wall…
-

4×5 LCD Video Wall for Shopping Center Event Spaces
Build a Flexible Twenty-Panel Canvas…
-

1×6 LCD Video Wall for Transport Operations Centers
Why Transport Information Benefits from…
-

5×1 Vertical LCD Video Wall for Transport Terminals
Present Five Levels of Travel…
Reviews
There are no reviews yet.