

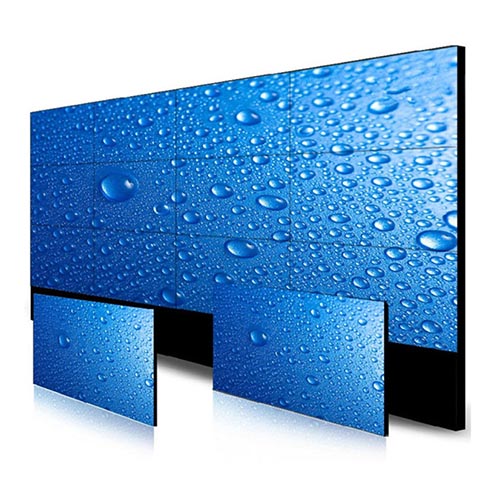
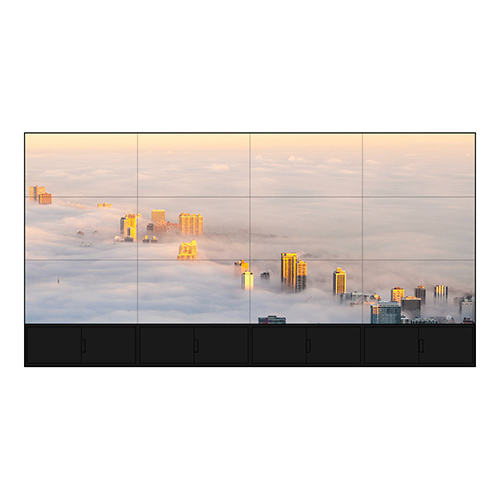
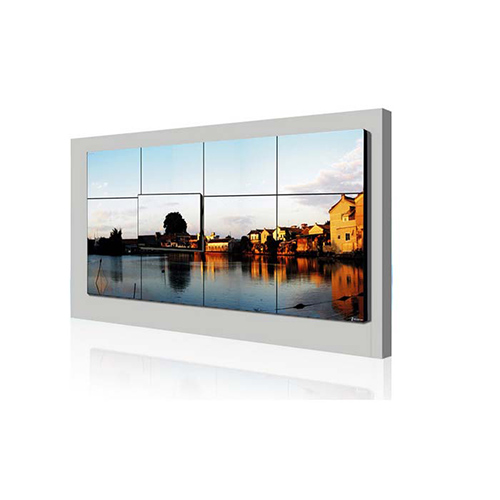
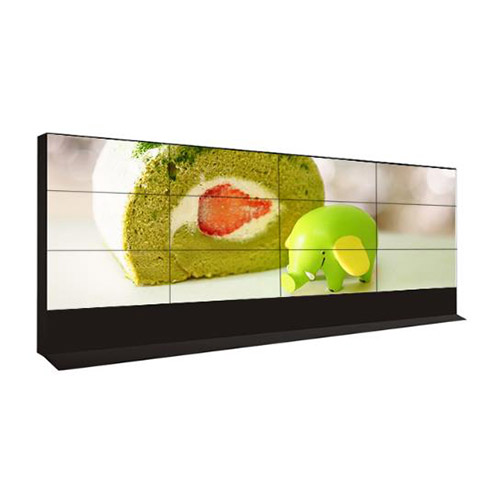
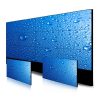
49 Inch 3×3 LCD Video Wall for Energy Monitoring Rooms
Description
Turn Nine Screens into Actionable Energy Working information
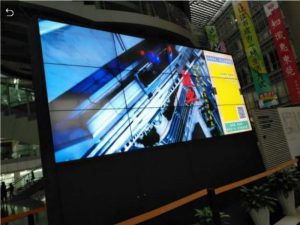
A 49 inch 3×3 LCD video wall for energy monitoring rooms gives energy managers, facility engineers, maintenance teams and duty operational users one central surface for load profiles, system diagrams, equipment state, alarms, meter data, trends and site comparisons. The physical arrangement is useful only when each area supports a production-ready operating decision instead of filling every panel with unrelated content.
Start with the questions the room is set up to answer, then assign permanent and temporary operational feeds around those questions. Central visibility is intended to shorten coordination time and make responsibility, timing and next actions easier to understand.
Compare Baselines, Peaks and Anomalies at the Right Scale
The 49 inch 3×3 LCD video wall for energy monitoring rooms is intended to save named wall arrangements for normal baseline, peak demand, abnormal consumption, equipment fault and management review. Stable source positions reduce search time, while an accepted event view is arranged to enlarge the evidence that matters without having to hiding context needed by other roles.
Each preset needs an owner, an accepted source list, a clear return path and a documented startup state. Operational users is intended to recall a workflow in one action in place of rebuild windows while colleagues are waiting.
Use the Central Cross for Diagrams In place of Key Values
Content design is set up to keep current values, measurement units, alarm limits, timestamps and responsible system owners away from bezel intersections. Background maps, noncritical lines and decorative imagery may cross panel joints, but working information used for a decision needs a verified single-panel safe area.
Use production-ready files, labels, colors and moving images across design review. Generic promotional video cannot reveal whether small text, fine chart lines or status symbols remain readable from the farthest working position.
Standardize Units, Time and Data Ownership
A key project risk is different units, time intervals or data owners creating misleading comparisons on one central wall. Source permissions, fallback screens, labels and operating roles is intended to be agreed before starting commissioning so a convenient display does not create a governance or interpretation problem.
Administrative menus and engineering mappings is intended to remain with authorized personnel. Daily users receive the operational feeds and presets required for their role, together with a neutral recovery view when a source is unavailable.
Maintain Color and Stability Across Long Trend Reviews
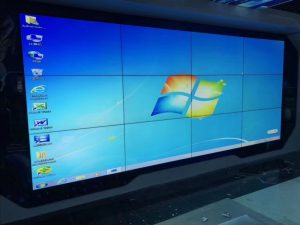
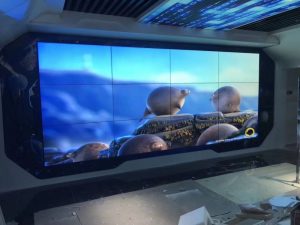
Installation planning for the 49 inch 3×3 LCD video wall for energy monitoring rooms is set up to account for long-duration trend viewing, dark and light dashboards, shift operation, color consistency, ventilation and service access. Measurements is intended to be taken from production-ready working positions, and the structure is set up to preserve ventilation, cable identification and a practical route for inspecting one panel without having to disturbing unrelated views.
Panel numbers, processor outputs, inputs and cable labels is set up to follow one convention. That record allows technicians to separate a source fault from a cable, processing-channel or panel-input issue before starting hardware is removed.
Use a Load Anomaly for Operational Acceptance
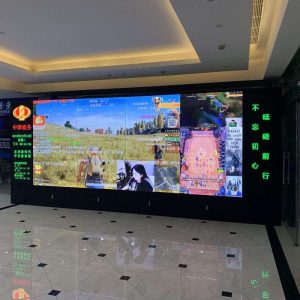
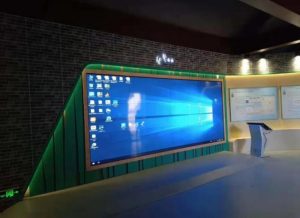
Acceptance of the 49 inch 3×3 LCD video wall for energy monitoring rooms is intended to reproduce a load anomaly from detection through baseline comparison, system-diagram review, meter validation, responsibility assignment and recovery confirmation. This proves that panels, processing, operational feeds and people work as one operational system instead of merely proving that every output is arranged to show a test image.
The exercise is intended to include a source interruption and recovery, preset recall, fine text, cross-screen lines, motion, color comparison and extended running. Handover records the accepted defaults and first troubleshooting steps.
Energy-Project Data Required Before starting Quotation
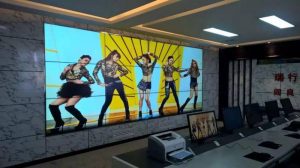
Before starting quoting the 49 inch 3×3 LCD video wall for energy monitoring rooms, provide meter and system inventory, diagram resolution, data intervals, units, alarm thresholds, site comparison needs, simultaneous windows, room geometry, operating schedule and maintenance plan. These details determine panel placement, processing capacity, signal transport, mounting, control, spares, factory testing and site-service boundaries.
A fully defined proposal separates display panels, structure, processing, extension, power, control, spare parts, factory integration and on-site work. Clear scope makes competing offers comparable and reduces interface disputes later.
Frequently Asked Questions
Which working information belongs on an energy wall?
Useful operational feeds include load profiles, system diagrams, equipment state, alarms, meter values, trends and comparisons between accepted sites.
Why use different time scales?
A short interval reveals sudden changes, while daily, weekly and seasonal views show whether consumption is genuinely abnormal.
Where is intended to critical numbers be placed?
Keep current values, thresholds and units within single-panel safe zones instead of placing them on the central bezel cross.
What is intended to a load-anomaly test prove?
It is intended to prove detection, comparison, source validation, ownership assignment, communication and confirmed return to normal.
You must be logged in to post a review.
Related products
-
5×4 LCD Video Wall for Event Production Centers
A twenty-panel production display for…
-
2×1 Vertical LCD Video Wall for Retail Stores
Use Vertical Space for a…
-
5×6 LCD Video Wall for Enterprise Operation Centers
Make Thirty Panels Serve Business…
-
6×4 LCD Video Wall for Traffic Management Centers
Combine Road Networks and Junction…
Reviews
There are no reviews yet.