

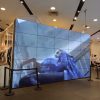


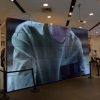
5×5 LCD Video Wall for City Command Centers
Description
Build a Shared City Picture on a Square Canvas
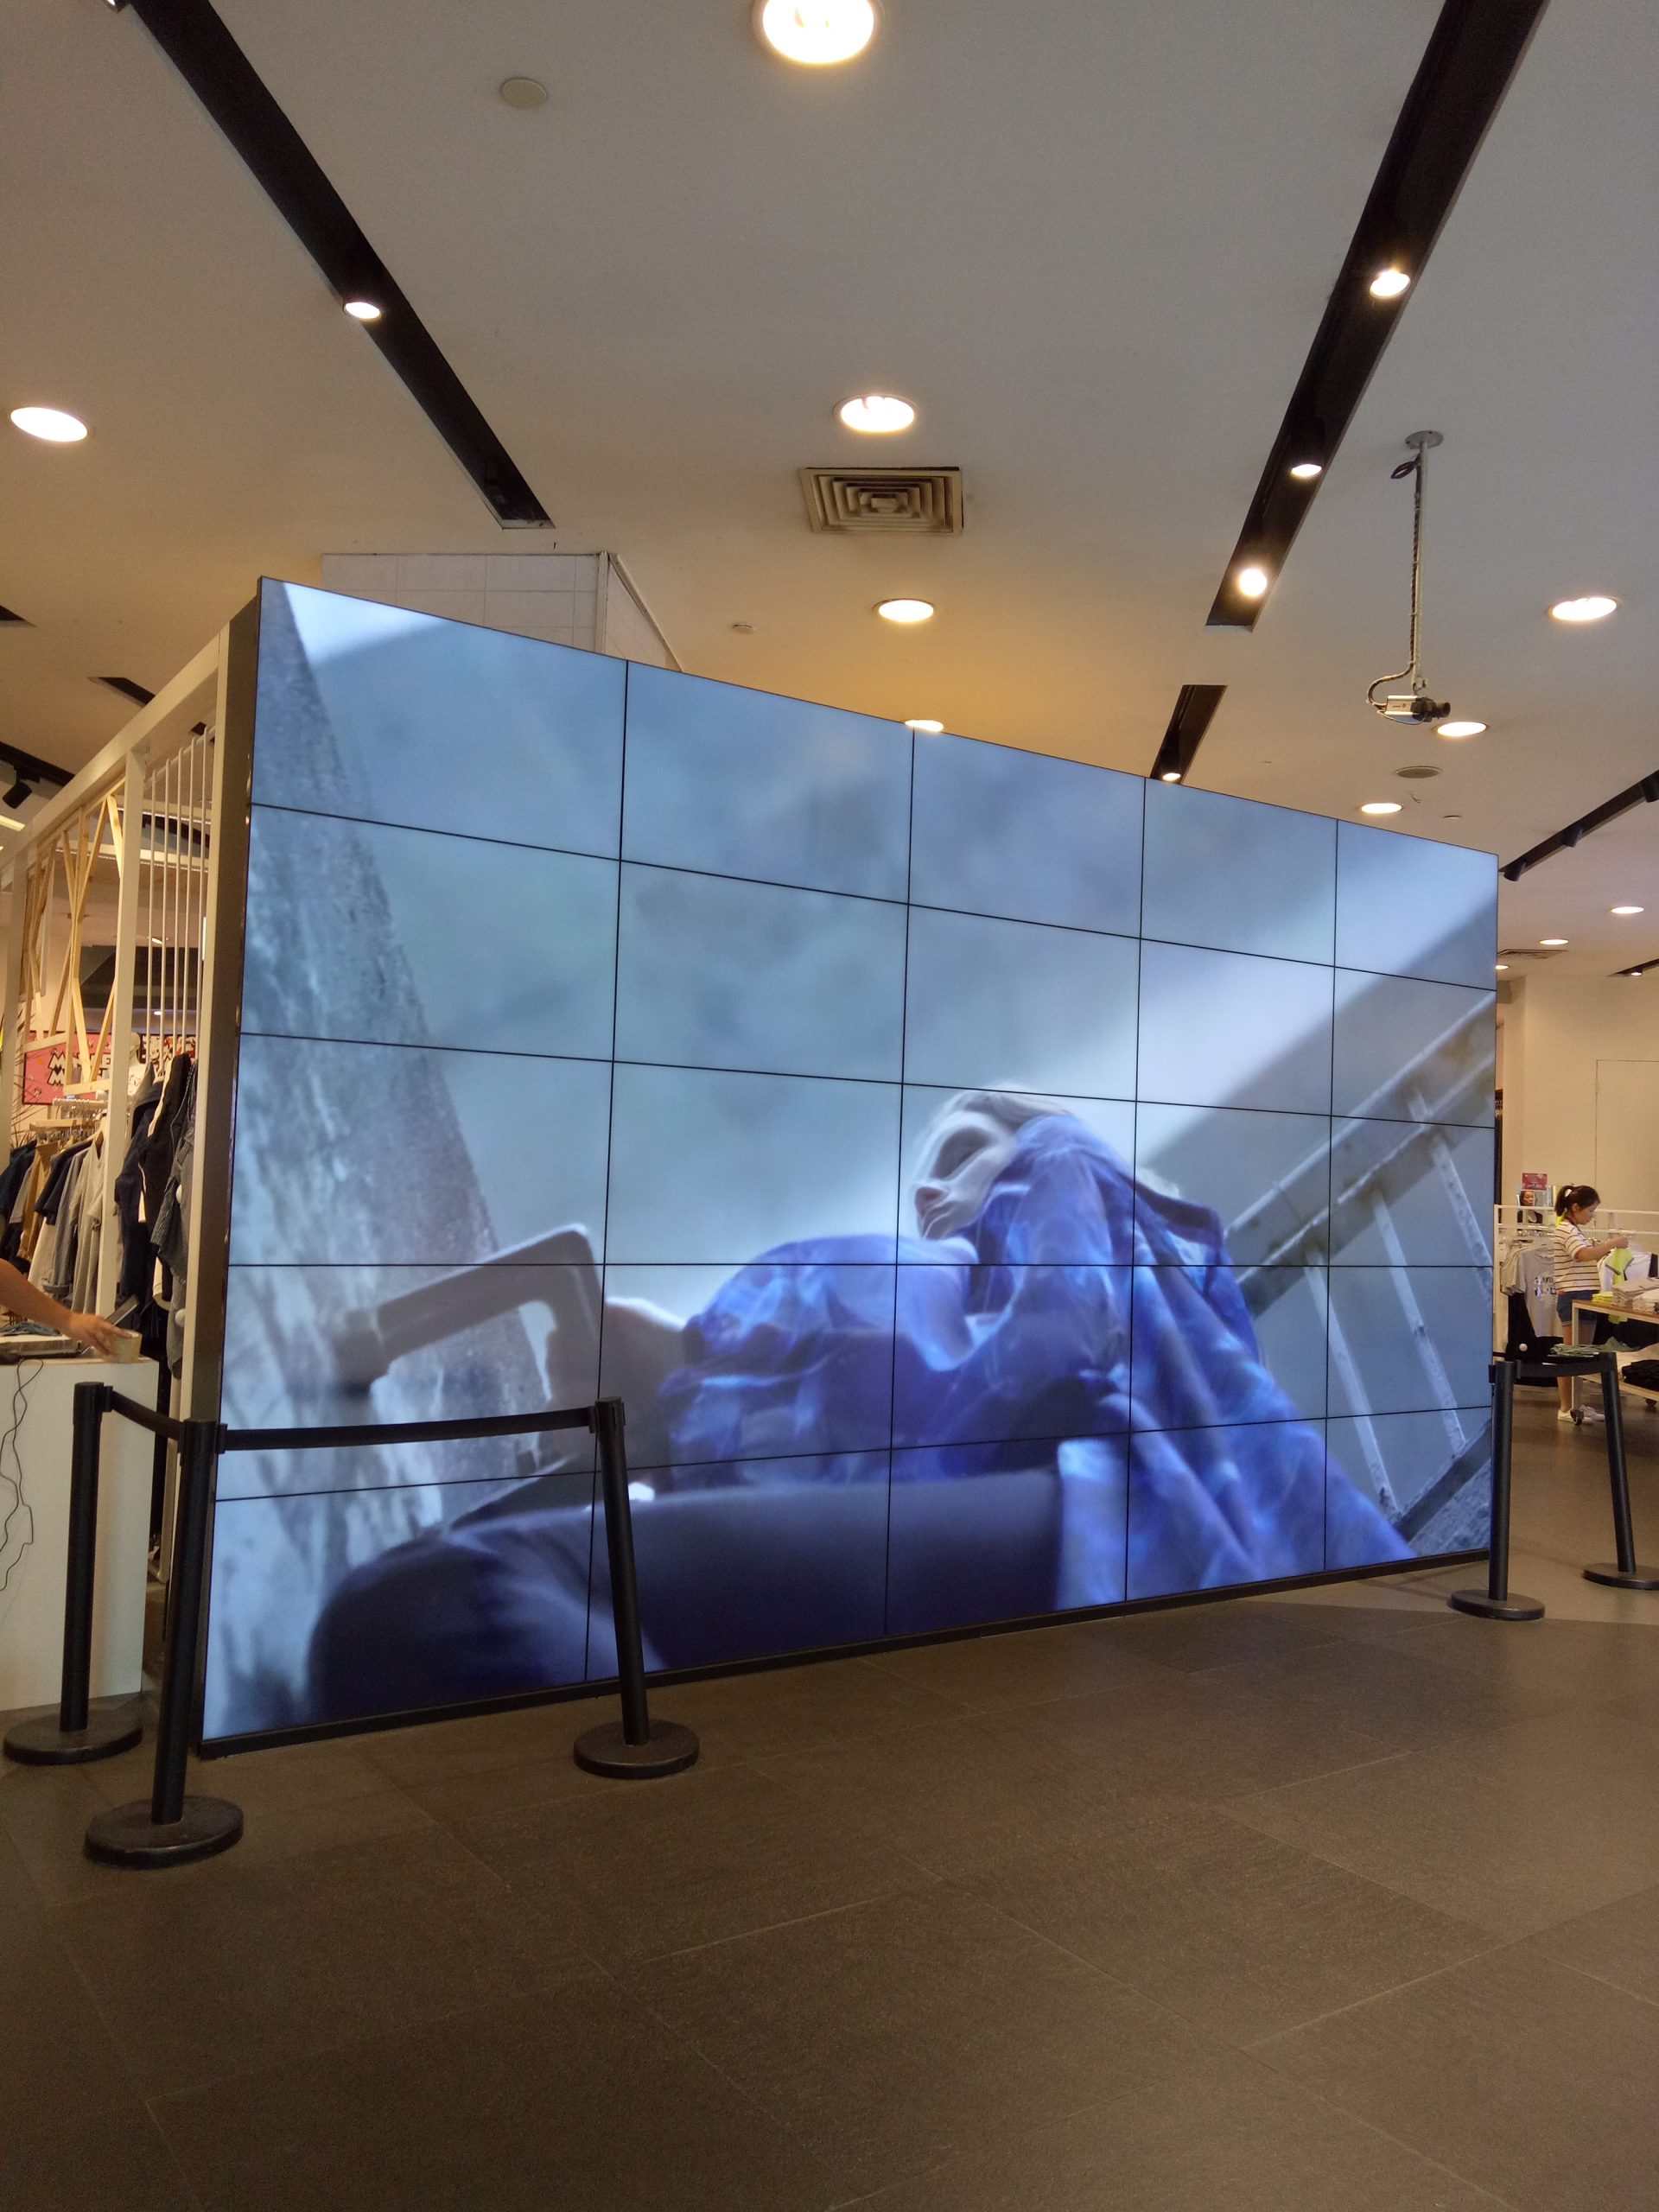
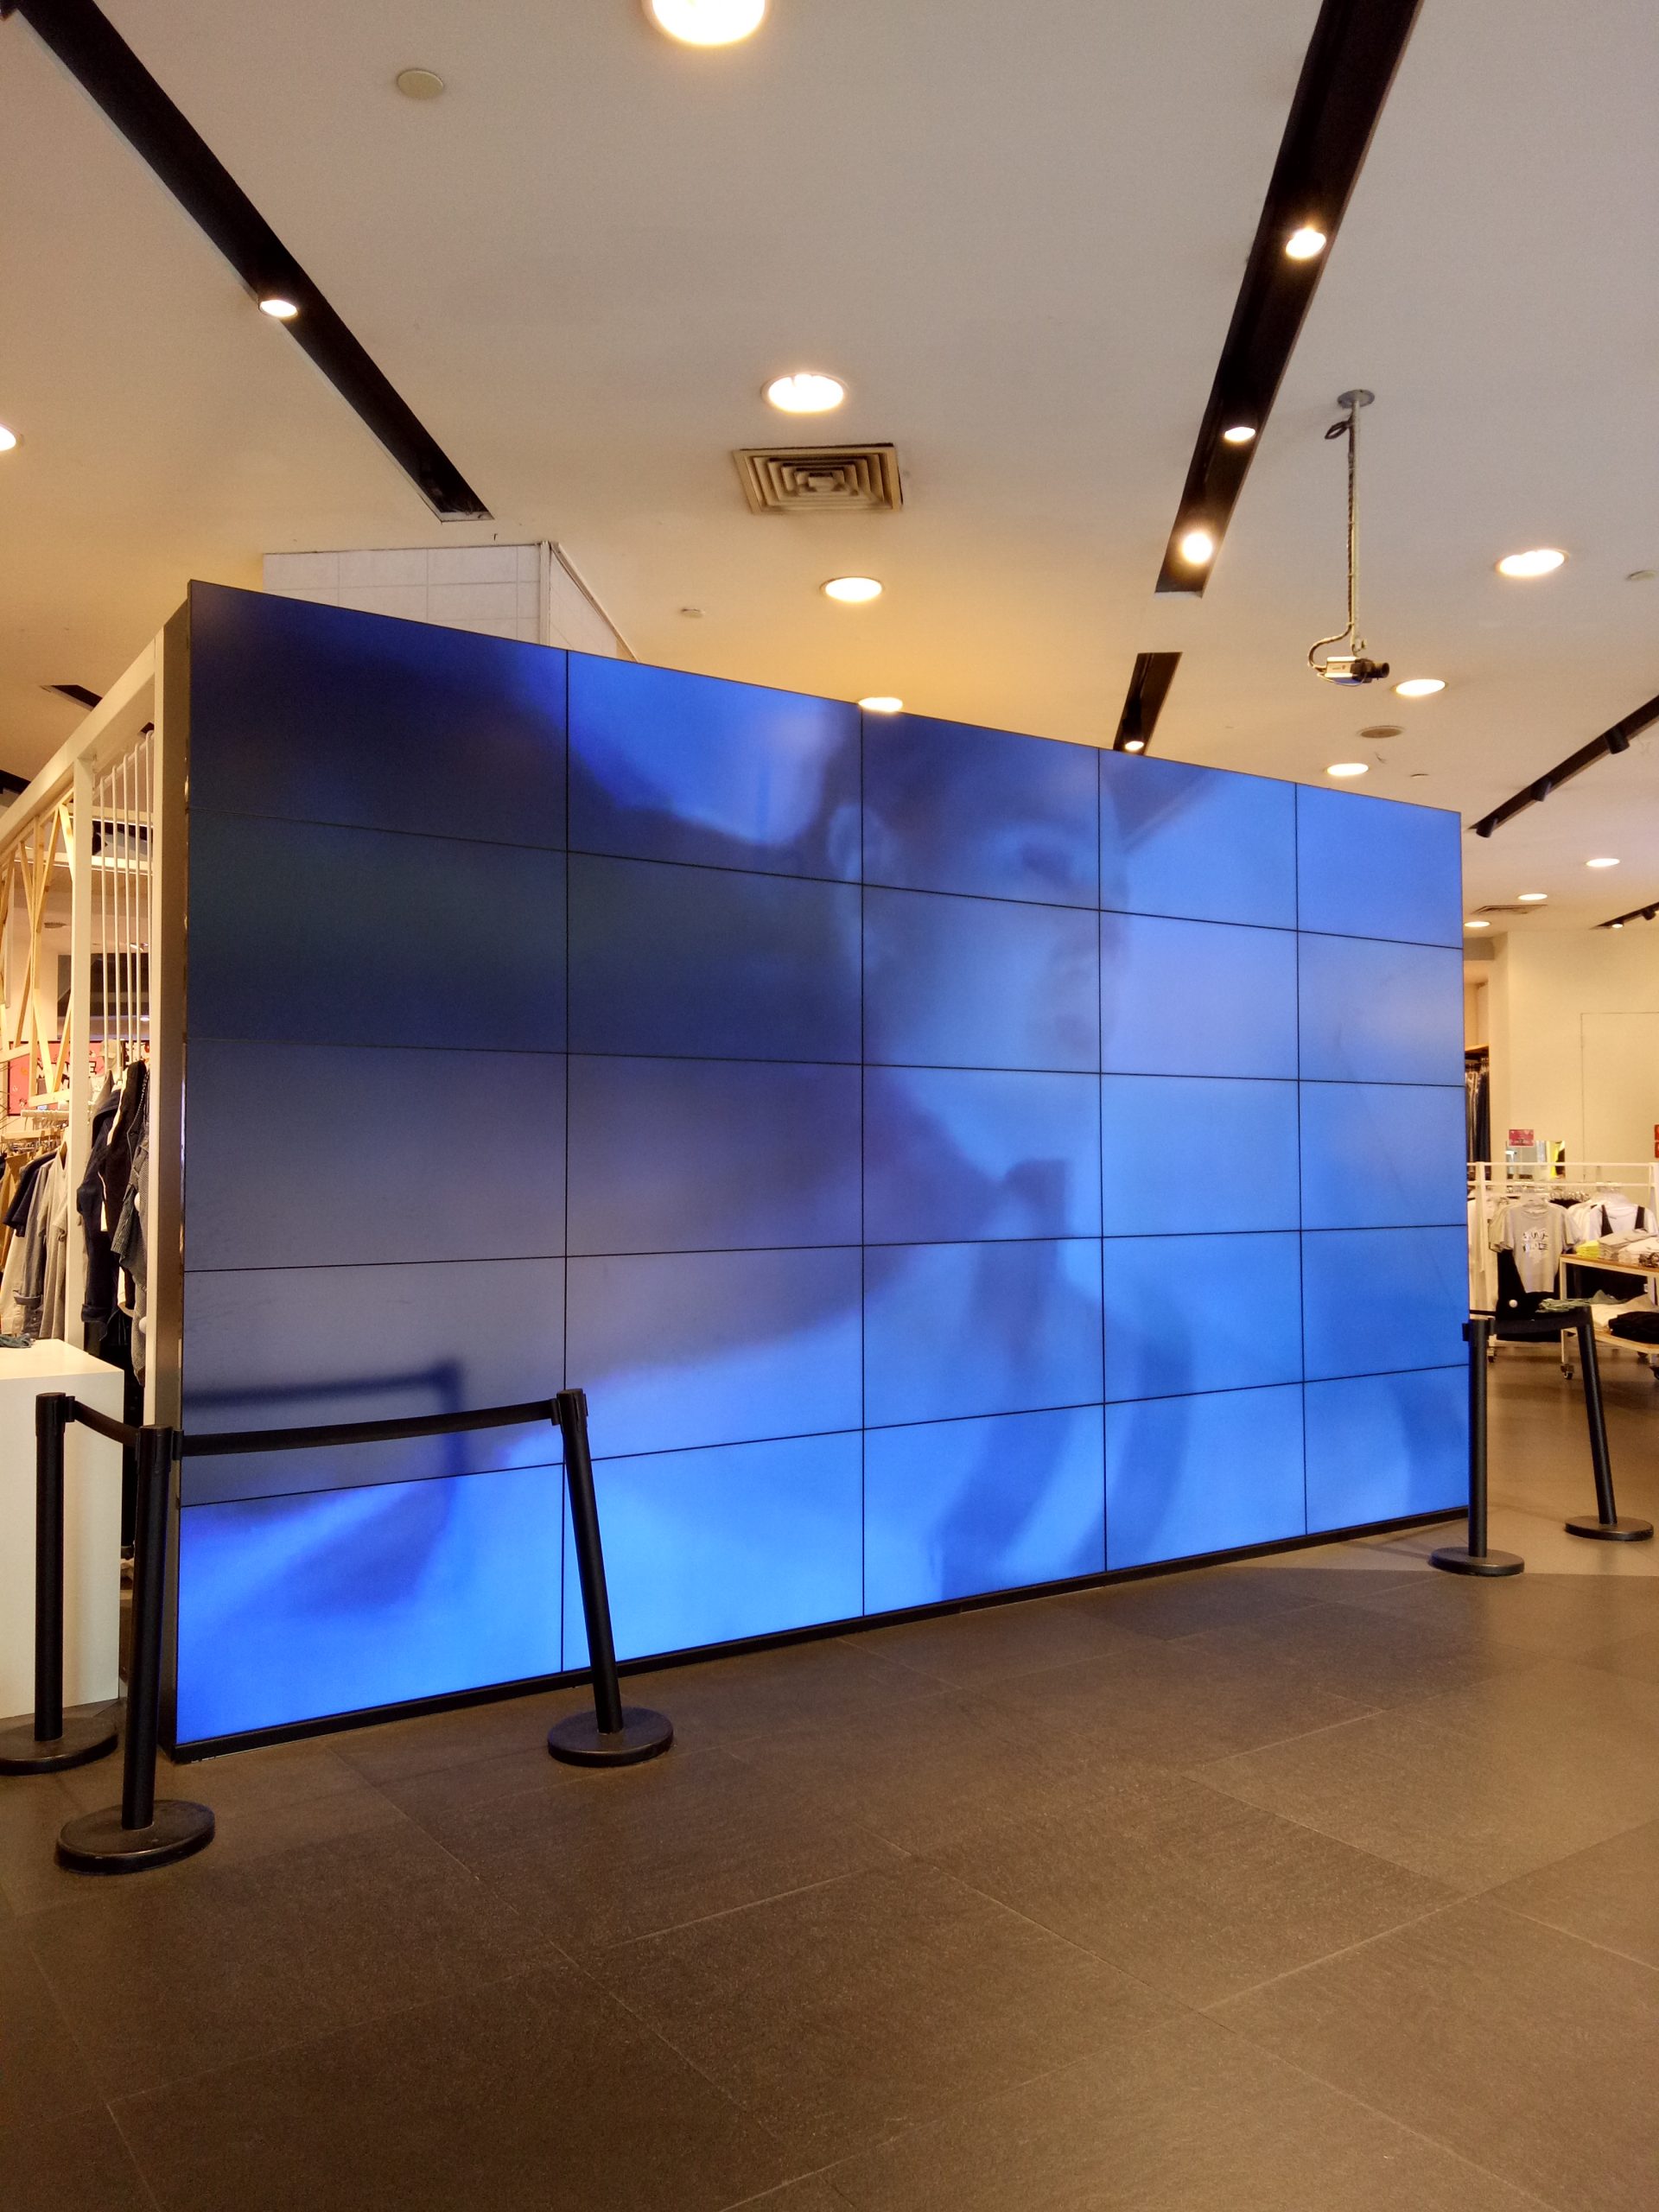
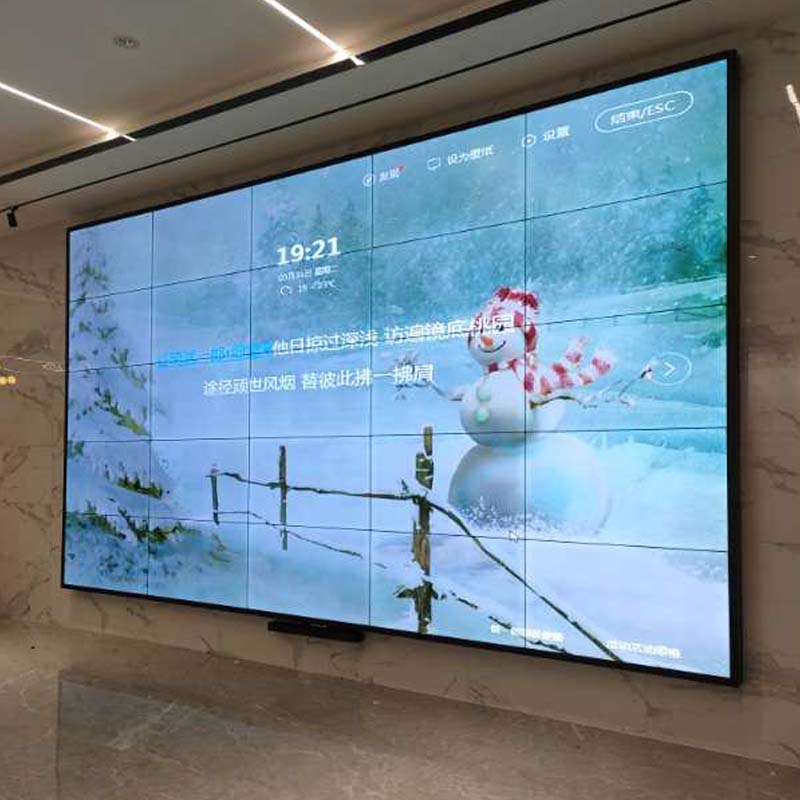
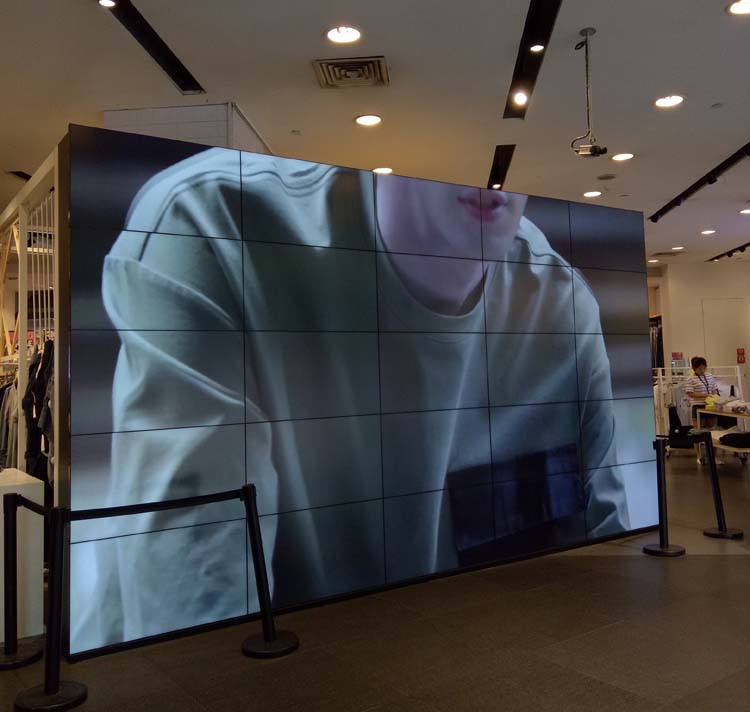
A 5×5 LCD video wall for city command centers provides twenty-five display zones for city operations, emergency coordination and integrated management. A map or primary incident can occupy the center while traffic, weather, safety, infrastructure and communications remain visible around it.
More panels should not mean every source is permanently displayed. Routine duty layouts can remain stable and restrained, then enlarge the relevant map, video and resource status when an incident develops. This keeps priority visible rather than surrounding operators with unranked information. A shared visual reference also reduces conflicting descriptions when several agencies discuss the same location or developing event.
Drive Layouts with Each Stage of an Incident
Create presets for routine monitoring, verification, joint response and review. As an incident progresses, the primary view, responsible agencies, resource positions, communications and timeline change with the workflow, reducing the delay of manually arranging windows.
Every preset needs an owner and a defined return path. Command staff may approve a whole-wall transition, agencies may control only their assigned zones, and public information follows a separate release process. Preset changes should preserve a concise event header so the room never loses the reason for the current layout.
Protect Map Coordinates and Central Details
The center of a 5×5 grid contains both horizontal and vertical bezel relationships. Map labels, incident numbers, coordinates, faces and small tables belong in safe areas. Templates should define boundaries for map zoom, expanded video and multi-agency windows.
Operators at the rear must distinguish states, but color should not be the only cue. Combine text, icons and timestamps, and limit flashing effects. The 5×5 LCD video wall for city command centers should support long shifts without turning every status into an alarm. Map scale and label density should be tested using the actual console distance and the widest expected operating view.
Unify Data Names, Time and Ownership
Connected city platforms may use different names for the same place, event or asset. Establish a data dictionary that identifies the time source, refresh cycle, responsible agency and meaning of an abnormal state.
Maps, video, reports and conferences should show data time so an old source is not mistaken for live status. Role-based controls should protect sensitive information, recording and remote access in line with existing security policy. A disconnected or delayed feed needs a visible status rather than silently retaining its last successful image.
Design Infrastructure for Zoned Maintenance
Plan structure, power, signals and cooling so one service task does not remove the complete operating picture. Divide critical paths into documented zones and preserve essential maps or event lists through an approved fallback source.
UPS and redundant components should follow continuity targets: what must remain visible, how quickly service must recover and who performs the changeover. Clear objectives are more useful than adding duplicate equipment without an operating procedure. Zone diagrams and recovery instructions should be available to both duty supervisors and technical maintenance staff.
Complete Acceptance through a Joint Agency Exercise
Use a realistic city event to test detection, verification, dispatch, conference and recovery with the actual duty roles. Confirm that maps, videos, resources, meeting windows, timestamps and presets support the agreed command process.
Also test delayed data, loss of one input and restart of a control node. Final acceptance of the 5×5 LCD video wall for city command centers should document findings, recovery steps and responsible roles rather than only recording that all panels turned on. The exercise should include the handoff between agencies because responsibility changes can expose gaps in information ownership.
Prepare a System Inventory for Comparable Proposals
Provide room dimensions, console positions, viewing distances, connected platforms, source counts, map and conference requirements, operating hours and security rules. Include existing routers, networks, racks, power and supporting structure.
A proposal grounded in operating scenarios can separate display, processing, control, redundancy, mounting, cabling, commissioning and training. Competing solutions can then be measured against the same acceptance targets. For a 5×5 LCD video wall for city command centers, a verified system inventory keeps commercial proposals directly comparable.
Frequently Asked Questions
Must the wall show twenty-five independent signals?
No. A source can occupy one panel, a multi-panel zone or the full canvas according to the saved layout.
Can city maps and surveillance video appear together?
Yes. The processor can preserve a map zone and supporting video zones after interfaces and resolutions are confirmed.
Can each agency control only its own area?
Yes. Accounts, zones and preset permissions can follow the existing command structure.
Will one panel fault remove the full picture?
A panel fault is usually local, but the power and signal architecture determines the actual impact and must be documented.
Inquiry
You must be logged in to post a review.
Related products
-

3×4 LCD Video Wall for Emergency Coordination Rooms
Turn Twelve Screens into an…
-

4×4 LCD Video Wall for Network Operations Centers
A sixteen-panel monitoring canvas for…
-

2×3 LCD Video Wall System for Control Rooms
Six Panels for Continuous Monitoring…
-

3×9 LCD Video Wall for Executive Briefing Centers
Create a Shared Evidence Wall…
Reviews
There are no reviews yet.