

3×7 LCD Video Wall for Enterprise Network Operations Centers
Description
Organize the Wall by Business Service
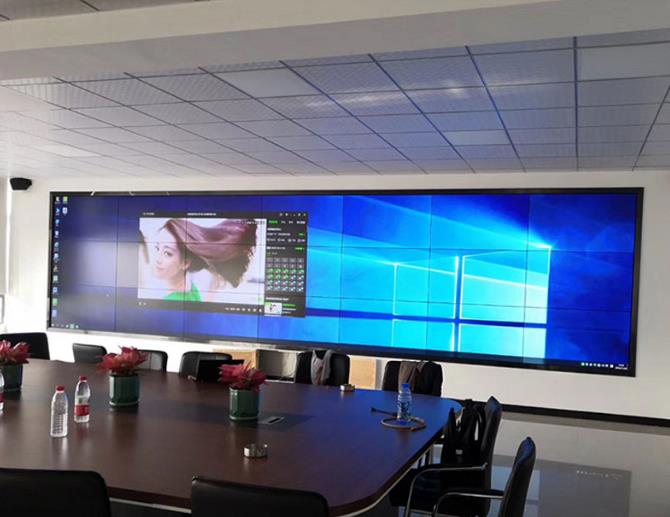
A network operations center should reveal service impact before device detail. The 3×7 LCD video wall for enterprise network operations centers uses 21 panels arranged in 3 rows and 7 columns to give network monitoring, cloud-platform, application operations, service-desk and incident-management teams a shared view of availability, performance and active incidents.
Inputs include network topology, service health, performance trends, ticket queues, major-incident collaboration, cloud resources and video conferences. Rather than dedicating one panel to one server, the wall groups them by business service, region and responsibility.
Use Twenty-One Panels Without Creating Visual Noise
The information architecture follows divide the wall by business service rather than device count, with enterprise health in the center, infrastructure on one side and incident collaboration on the other. Stable positions let engineers recognize a change quickly and help managers understand which customer-facing service is affected.
On the 3×7 LCD video wall for enterprise network operations centers, excessive small widgets create noise. Use size, color and location to separate health summaries from the evidence opened during an escalation.
Keep the Far Ends Readable from Every Console
Seven columns can exceed a comfortable angle when consoles are too close. The seven-column width requires checking sightlines from every seat to both ends while controlling font size, mounting-level error, room illumination and distance from equipment racks. Test the far-left and far-right labels from every shift position before fixing font sizes.
The structure needs a continuous level reference, but operational ergonomics determine the final wall height. Reflections and ambient light should not hide dark dashboard elements during a long night shift.
Connect Monitoring and Incident Collaboration
Monitoring, ticketing and conferencing must work as one incident process. A 3×7 LCD video wall for enterprise network operations centers should allow an engineer to compare topology and trends while an incident manager follows ownership and communication.
Saved layouts can cover routine health, major incident, change window and management briefing. Permissions stop one team from replacing the shared view during another team’s response.
Define Alert Ownership on the Shared Wall
A red condition is useful only when the team knows who must respond. The wall design should connect service status with the responsible group, ticket number and escalation stage rather than displaying anonymous alarms.
During review, remove alerts that have no defined action. This keeps the shared display focused and reduces the chance that a major incident is hidden inside routine noise.
Measure Latency for Monitoring and Collaboration Sources
Dashboards, topology, screen sharing and video conferencing may refresh at different speeds. Establish acceptable latency for each source and test it through the complete processing path.
A delayed wall should not contradict the operator workstation during an incident. Time stamps and synchronized test events help distinguish display latency from the monitoring platform itself.
Create Day, Night and Change-Window Modes
A NOC at night may use lower room lighting and fewer staff, while a planned change window needs detailed implementation and rollback information. Separate presets can adjust content priority without changing core system configuration.
Review brightness and dark dashboard contrast in each mode. Operators should not need to manually rebuild the wall at the start of every shift.
Keep Expansion Controlled
New cloud regions and services will add dashboards, but unlimited growth leads to unreadable layouts. Define a review process for every proposed source: owner, decision supported, update rate and removal date.
Reserve processing capacity for approved growth while retiring obsolete views. The display remains useful when its information architecture is maintained as carefully as the hardware.
Measure Success with a Major-Incident Exercise
Use a major-incident simulation for acceptance: use a realistic major-incident drill to test alarm discovery, ownership assignment, trend comparison, conference connection, ticket escalation and return to normal operation. Measure how quickly the team finds the impact, opens supporting data and restores the normal view.
The 3×7 LCD video wall for enterprise network operations centers is ready when mappings, presets, text scale, cable labels and recovery steps support the NOC workflow rather than adding another system to manage.
Inputs Required for a NOC Design
For NOC planning, provide console locations, service groups, monitoring platforms, ticketing and conference outputs, dashboard resolutions, major-incident layouts, user roles and the expected growth in sources. Include the farthest seat and overnight lighting condition.
These details allow the 3×7 LCD video wall for enterprise network operations centers to be sized for legibility and operations. Processing, brackets, signal extension, management interfaces, spare parts and support can be quoted against a documented workflow. A sample dashboard pack also gives the project team objective text-size and color checks before production begins.
Frequently Asked Questions
How many panels are used in a 3×7 wall?
The layout contains twenty-one panels in three rows and seven columns.
Should each panel represent one server?
Usually not. Group information by service, region or responsibility so operators can understand impact instead of watching isolated devices.
How can operators read the two ends?
Select panel size and text scale from the console positions, then verify the viewing angle from every seat.
What systems should be tested together?
Test monitoring dashboards, topology, ticketing, conferencing and saved layouts during one incident workflow.
Inquiry
You must be logged in to post a review.
Related products
-
4×4 LCD Video Wall for Network Operations Centers
A sixteen-panel monitoring canvas for…
-
5×6 LCD Video Wall for Enterprise Operation Centers
Make Thirty Panels Serve Business…
-

1×3 LCD Video Wall for Retail Wayfinding Systems
Turn Three Horizontal Panels into…
-
2×4 LCD Video Wall System for Surveillance Centers
Eight Panels for a Clear…
Reviews
There are no reviews yet.